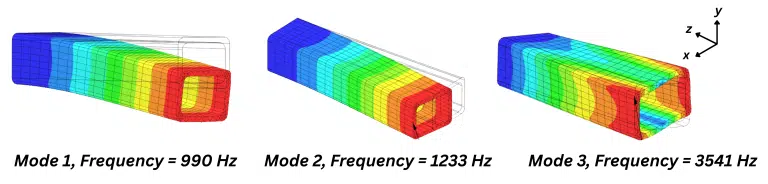
Modal analysis is the backbone of structural dynamics. Learn to predict natural frequencies, understand mode shapes, and validate your FEA models against experimental data.
Master vibration analysis. Learn how Frequency Response Functions (FRF) characterize system dynamics, identify resonance, and enable precise modal analysis and structural health monitoring.
Stop using FFT for random vibration. Discover why Power Spectral Density (PSD) is the industry standard for accurate testing and how to interpret g²/Hz.
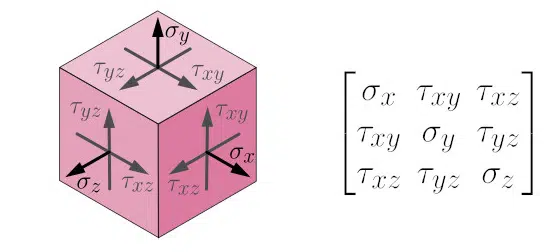
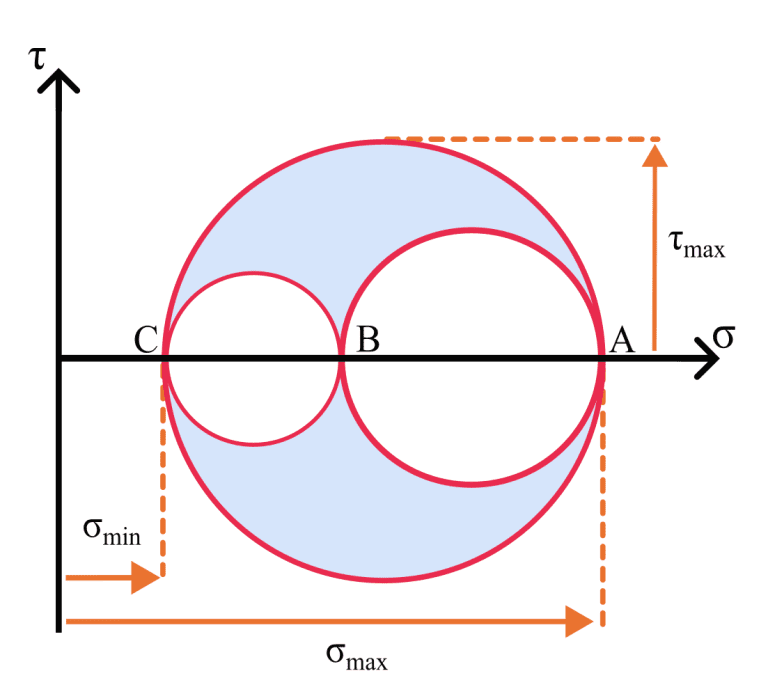
Visualize complex 3D stress states instantly. Compute principal stresses, maximum shear, and failure criteria like Von Mises with our interactive, professional-grade Mohr’s Circle calculator.
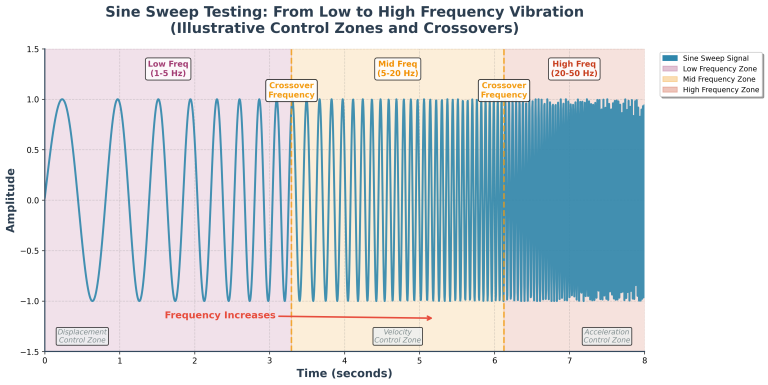
Don't just find resonance—quantify it. Go beyond modal analysis with this guide to sine sweep testing, control strategies, and interpreting Frequency Response Functions (FRF).
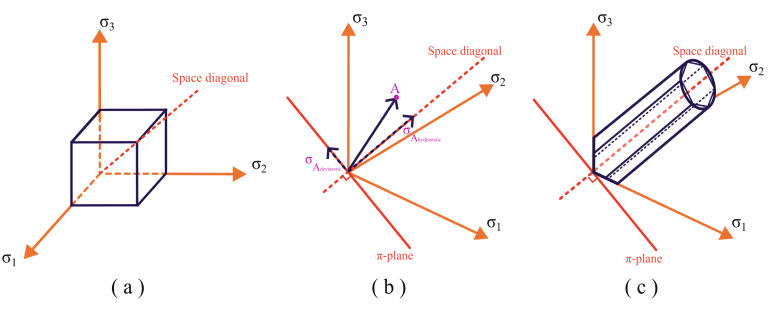
From simple tension tests to complex components: discover how to use yield criteria to accurately predict structural failure and validate your finite element analysis results.
Missing strain hardening data? Learn to approximate true stress-strain curves for ductile materials in FEA using the alternative Ramberg-Osgood method and simple tensile properties.
Simplify complex stress analysis. Learn to use Mohr’s Circle to visualize stress states, find principal planes, and predict material failure without lengthy algebraic calculations.
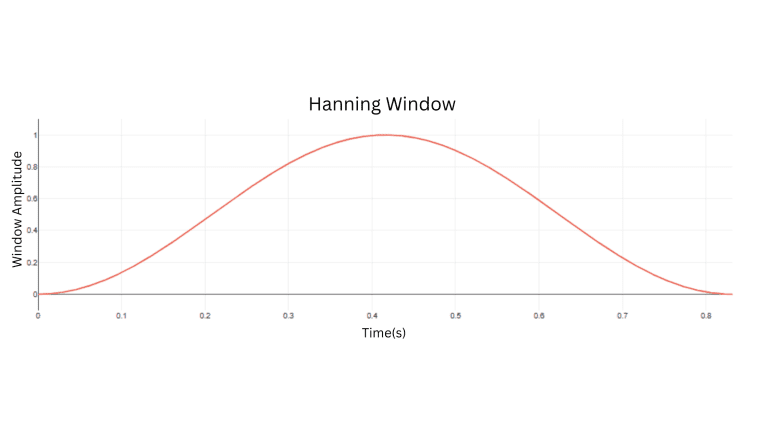
See spectral leakage vanish. Use our interactive plots to visualize how Hanning windows taper signals and improve FFT accuracy compared to Rectangular windows.