Diagram illustrating the Shock Response Spectrum (SRS) calculation process: transforming a time-domain transient event into a frequency-domain peak response curve using an array of SDOF oscillators.

Vibration

Shock Response Spectrum (SRS) Analysis: Ultimate Guide

Master Shock Response Spectrum (SRS) analysis for structural qualification. Learn to calculate peak responses, distinguish SRS from PSD, and validate hardware against pyroshock and seismic events.
FEA Modal Analysis. Three vibration mode shapes of a hollow rectangular beam showing Mode 1, Mode 2, and Mode 3 with color-coded deformation patterns from blue (minimal displacement) to red (maximum displacement)

Vibration

FEA Modal Analysis: Mode Shapes & Natural Frequencies

Modal analysis is the backbone of structural dynamics. Learn to predict natural frequencies, understand mode shapes, and validate your FEA models against experimental data.
Block diagram showing frequency response function H(ω) as transfer function between input excitation F(ω) and output response X(ω) in frequency domain analysis

Vibration

Frequency Response Function: Complete Theory & Applications Guide

Master vibration analysis. Learn how Frequency Response Functions (FRF) characterize system dynamics, identify resonance, and enable precise modal analysis and structural health monitoring.
Comparison of sinusoidal vs random vibration in time domain showing predictable sine wave pattern versus unpredictable random signal, with corresponding frequency domain representations

Vibration

The total Guide to Random Vibration Analysis and Power Spectral Density (PSD) in 2025

Stop using FFT for random vibration. Discover why Power Spectral Density (PSD) is the industry standard for accurate testing and how to interpret g²/Hz.
sine sweep testing logarithmic frequency progression vibration analysis displacement acceleration control zones

Vibration

Sine Sweep Testing: A Practical Guide to Vibration Analysis

Don't just find resonance—quantify it. Go beyond modal analysis with this guide to sine sweep testing, control strategies, and interpreting Frequency Response Functions (FRF).
Plot of a Hanning window function over an 0.83 s time interval, smoothly tapering from zero at the start to a peak at mid-window and back to zero at the end

Vibration

Windowing in FFT: Improve Accuracy Using Hanning vs Rectangular Windows

See spectral leakage vanish. Use our interactive plots to visualize how Hanning windows taper signals and improve FFT accuracy compared to Rectangular windows.
Aliasing demonstration in vibration signal sampling at 200 Hz showing 20 Hz and 180 Hz analog signals with visible aliasing effect

Vibration

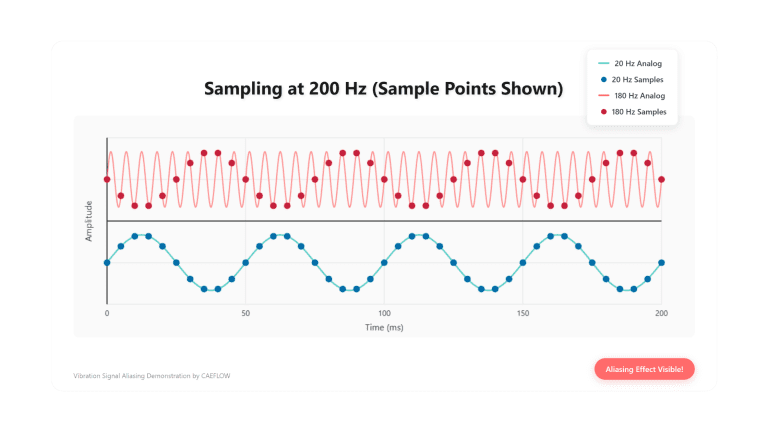
Aliasing Explained: Crucial Digital Signal Analysis Concept Every Engineer Must Know

Prevent signal distortion. Understand the Nyquist-Shannon theorem, why sampling rates matter, and how to use anti-aliasing filters to ensure your digital signal processing remains accurate.
Scroll to Top