The Complete Guide to Random Vibration Analysis and Power Spectral Density (PSD) in 2025
Learn why Power Spectral Density (PSD) is the industry standard for analyzing random vibration, and master the fundamental differences between FFT and PSD for accurate vibration testing.
Table of Contents
Introduction: What is Random Vibration?
Random vibration is unpredictable mechanical motion that contains energy across multiple frequencies simultaneously, unlike sinusoidal vibration which operates at a single frequency. It requires statistical analysis methods like Power Spectral Density (PSD) to characterize amplitude and frequency content.
Understanding Random Vibration Through Mechanical Systems
In mechanical vibration, we study how structures respond to input loads, whether from base motion acceleration or applied forces. When the input is random, we enter the realm of random vibration analysis. Wind fluctuations on turbine blades, airplane turbulence, and road-induced vibration are examples of random vibration. Since random inputs cannot be predicted exactly at any given instant, we must describe them statistically using measures like standard deviation, RMS values, power spectral densities, and probability distributions. While we cannot determine the precise value at a specific time, we can confidently predict these statistical properties.
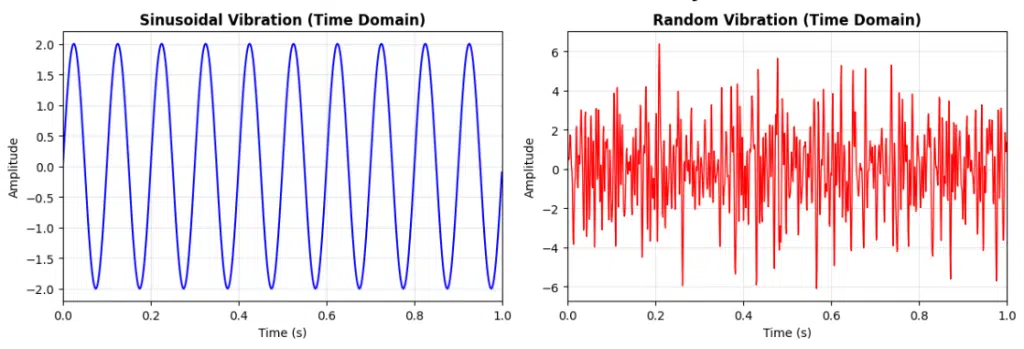
To understand random vibration, consider rolling dice: you know the outcome will be 1-6, but you cannot predict which number will appear next. Random vibration can contain energy across a broad frequency spectrum—like white noise which resembles white light—while sinusoidal vibration operates at a single frequency, like a laser beam. Crucially, when the input is random, the structural response is also random, requiring both input and output to be characterized through statistical and probabilistic methods.
Why Random Vibration Matters?
Products don’t experience perfect sine waves in real life. They experience:
- Complex combinations of frequencies all at once
- Unpredictable variations in amplitude and timing (see Figure above)
- Statistical patterns rather than deterministic (predictable) motion
That’s why we need special tools to analyze and test for random vibration – which brings us to understanding how we look at these signals.
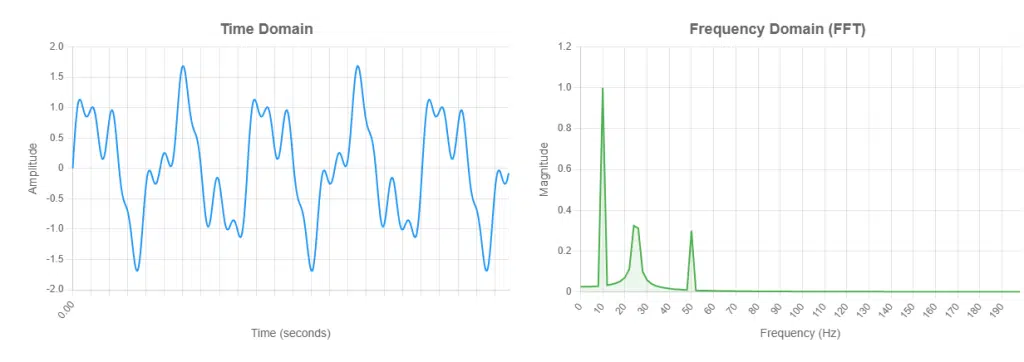
Time domain vs Frequency domain
Time domain shows how vibration amplitude changes over time, while frequency domain reveals which frequencies contain the most energy. Converting between domains using Fast Fourier Transform (FFT) allows engineers to identify resonances, characterize systems, and design effective vibration tests.
Understanding the Two Domains
Think of these domains like two different ways of looking at music:
- Time Domain: Like reading sheet music – you see when each note plays
- Frequency Domain: Like seeing a graphic equalizer – you see which pitches are present
Fourier showed that any periodic signal can be described by a summation of sinusoidal signals (deterministic). A periodic signal is a signal that is repetitive, and future instants can be described and predicted based on previous points in time, as opposed to a random signal.
There is value in converting from the time domain to the frequency domain since, by doing so, we can determine the frequency of each sinusoidal signal and gain insight into the signal’s composition. Additionally, it can be shown that one can transform back and forth between the time domain and frequency domain through the Fourier Transform and Inverse Fourier Transform (implemented computationally as the FFT and IFFT).
Why FFT Isn't Enough: The Need for PSD
While FFT is excellent for converting between time and frequency domains, it has a critical limitation for random vibration analysis: FFT magnitude depends on record length.
The FFT Problem
When you compute an FFT of a random signal, trimming or extending the time record changes the FFT amplitude – even though the underlying vibration hasn’t changed. This makes FFT unreliable for quantifying random vibration levels.
Consider measuring ocean waves: if you record for 10 seconds versus 100 seconds, the FFT amplitudes will differ despite the ocean’s behavior remaining constant. This dependency makes it impossible to compare measurements of different durations or establish consistent test specifications.
The PSD Solution
Power Spectral Density (PSD) solves this by normalizing the power by frequency bandwidth (Hz). This normalization makes PSD magnitude independent of record length – longer records simply provide smoother, more accurate estimates of the same underlying PSD level.
Key Difference:
- FFT amplitude: Depends on measurement duration (inconsistent)
- PSD amplitude: Independent of measurement duration (consistent)
This is why vibration test standards specify random vibration in PSD units (g²/Hz) rather than FFT amplitude. PSD provides a true measure of vibration intensity at each frequency, regardless of how long you measure.
What is Power Spectral Density (PSD)?
Power Spectral Density (PSD) is a frequency domain analysis tool that describes how vibrational power distributes across different frequencies. It’s calculated by squaring the FFT magnitude and normalizing by frequency resolution, providing consistent results independent of measurement duration—making it the industry standard for random vibration analysis.
Understanding PSD in Simple Terms
Imagine you are in a crowded restaurant. You hear many conversations, clattering dishes, and background music all mixed together. Your ear naturally breaks this down – you can focus on nearby conversations or notice when a glass breaks. PSD does something similar for vibration: it takes a complex, mixed signal and shows you exactly what’s happening at each frequency.
Think of PSD as a way to break down a noisy, complex signal into a map of where its energy lives, so engineers can understand and test how structures handle realistic, random shaking — like wind gusts, road bumps, or shipping vibrations.
Understanding PSD in Vibration Analysis
Power Spectral Density reveals how the power (or energy) of a vibrating signal is distributed across different frequencies. While it’s mathematically derived from the FFT—by squaring the magnitude and normalizing by the frequency resolution (bandwidth)—PSD provides what FFT cannot: stable, statistical characterization of random processes.
For random vibrations, we’re interested in statistical properties rather than instantaneous values. PSD delivers exactly this by representing the average frequency characteristics of the random process, regardless of how long we measure. This makes PSD the definitive tool for specifying vibration test levels, analyzing field data, and comparing measurements across different systems and timeframes.
Below is an interactive explanation demonstrating PSD’s advantages for analyzing random vibration.
Understanding PSD Units (g²/Hz)
The unit g²/Hz tells you the acceleration squared per unit frequency:
- g² = acceleration squared (where g = 9.81 m/s²)
- /Hz = per unit frequency bandwidth
To find RMS acceleration in a frequency band:$\sqrt{\text{PSD} \times \text{bandwidth}}$
Example: PSD of 0.1 g²/Hz over 10 Hz band = $\sqrt{0.1 \times 10} = 1$ g RMS
Reading a PSD Plot:
- Y-axis: Power density (g²/Hz) – often on log scale
- X-axis: Frequency (Hz) – often on log scale
- Higher values = more vibration energy at that frequency
- Flat regions = constant energy across frequencies (white noise)
- Peaks = resonances or specific vibration sources
FFT vs PSD: A Practical Example
Consider recording the same vibration for different durations:
FFT Results (NOT normalized):
- 10-second recording: FFT peak = 2.5 g
- 100-second recording: FFT peak = 7.9 g
- Same vibration, different values! ❌
PSD Results (normalized by bandwidth):
- 10-second recording: PSD = 0.05 g²/Hz
- 100-second recording: PSD = 0.05 g²/Hz
- Same vibration, same value! ✅
This is why test standards specify random vibration in PSD, not FFT amplitude. PSD ensures consistent, comparable measurements regardless of test duration.
Interactive Demonstration
Window: 0% | FFTs: 0
Current Window View
Current Window FFT
PSD (Average of All FFTs)
FFT Variability Over Time
What This Shows:
- Window View: Red = active analysis window
- FFT Changes: Varies between windows
- PSD Convergence: Stabilizes over time
- Variability: Frequency fluctuations
Key Takeaway:
Single FFT = Unreliable. PSD = Reliable frequency content.
Frequently Asked Questions (FAQ)
What is random vibration?
Random vibration is unpredictable mechanical motion that contains energy across multiple frequencies simultaneously, unlike sinusoidal vibration which operates at a single frequency. It cannot be predicted exactly at any given instant and requires statistical analysis methods like Power Spectral Density (PSD) to characterize its amplitude and frequency content.
What’s the difference between time domain and frequency domain?
Time domain shows how vibration amplitude changes over time, while frequency domain reveals which frequencies contain the most energy. Time domain is like reading sheet music (you see when each note plays), while frequency domain is like seeing a graphic equalizer (you see which pitches are present).
Why isn’t FFT sufficient for random vibration analysis?
FFT magnitude depends on record length – trimming or extending the time record changes the FFT amplitude even though the underlying vibration hasn’t changed. This makes FFT unreliable for quantifying random vibration levels and impossible to compare measurements of different durations.
What is Power Spectral Density (PSD)?
Power Spectral Density (PSD) is a frequency domain analysis tool that describes how vibrational power distributes across different frequencies. It’s calculated by squaring the FFT magnitude and normalizing by frequency resolution, providing consistent results independent of measurement duration.
What does g²/Hz mean in PSD measurements?
The unit g²/Hz tells you the acceleration squared per unit frequency bandwidth, where g = 9.81 m/s² and /Hz = per unit frequency bandwidth. To find RMS acceleration in a frequency band, you calculate the square root of (PSD × bandwidth).
How do I read a PSD plot?
On a PSD plot, the Y-axis shows power density (g²/Hz) often on log scale, and the X-axis shows frequency (Hz) often on log scale. Higher values indicate more vibration energy at that frequency, flat regions show constant energy across frequencies (white noise), and peaks indicate resonances or specific vibration sources.
Summary
Random vibration analysis is essential for understanding how products respond to real-world conditions. While FFT helps us move between time and frequency domains, its dependence on record length makes it unsuitable for characterizing random vibration. PSD solves this by normalizing the power by frequency bandwidth, providing consistent measurements that enable engineers to:
- Compare vibration data from different test durations
- Establish reliable test specifications
- Predict product reliability under random loading
Understanding these fundamentals prepares you for more advanced topics like the Miles equation, degrees of freedom in PSD calculations, and practical vibration testing applications—which we’ll explore in upcoming articles. For the other topics regarding vibration, please have a look at : CAEFLOW
References (clickable):
- Brüel & Kjær. (2018). The frequency domain: FFT & PSD made easy [Application note]. Brüel & Kjær.
- Hottinger Brüel & Kjær (HBK). (n.d.). Knowledge base: Spectral analysis and random vibration reference articles.
- Performing Random Vibration Analysis Using Ansys Mechanical, ANSYS Learning.
- Lalanne, C. (2009). Mechanical vibration and shock analysis: Volume 3 – Random vibration (2nd ed.). Wiley.
- MathWorks. (n.d.). Power spectral density estimates using FFT.
- National Instruments. (2012). Understanding power spectral density (PSD) measurement.
- Newland, D. E. (2012). An introduction to random vibrations, spectral & wavelet analysis (3rd ed.). Dover Publications.

I am a senior CAE and Automation Engineer at Scania with over 7 years of hands-on experience in Finite Element Analysis (FEA). My daily work involves advanced simulations focusing on strength and durability analysis, helping design more reliable and efficient products.
Before joining Scania, I conducted research at KTH Royal Institute of Technology, where I focused on the additive manufacturing of heat exchangers. My work has been recognized internationally and published in peer-reviewed journals. You can find my publications on Google Scholar.