Key Takeaways
- Hot spot stress extrapolation eliminates mesh singularity problems at weld toes
- Match your stress extraction method to the correct S-N curve
- Use element size ≤ 0.4t at weld toes for hot spot stress analysis
- Peak stress at sharp weld corners diverges and has no physical meaning.
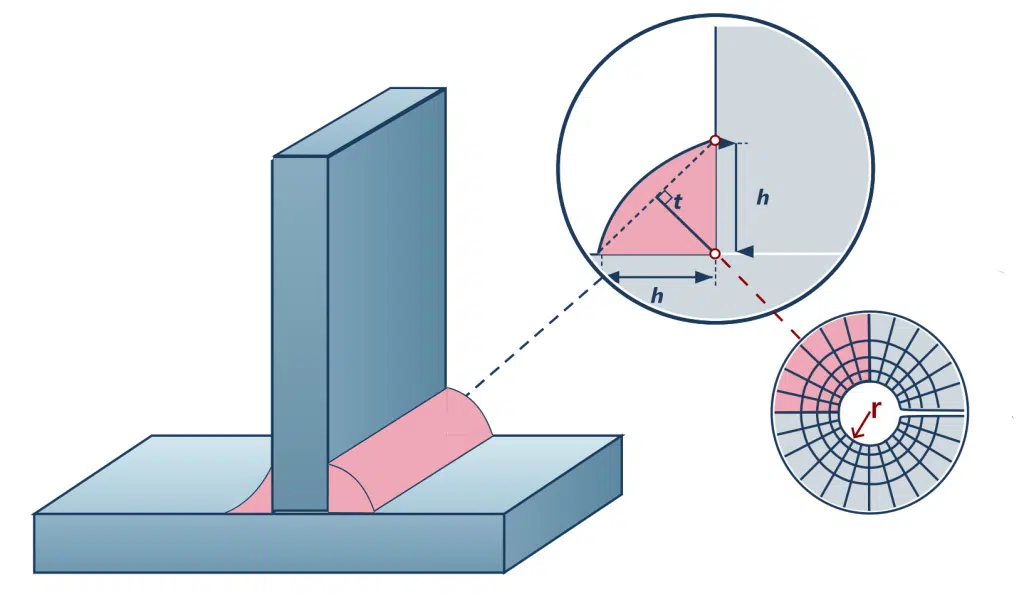
Table of Contents
Understanding Weld Representation in FEA Models
Weld representation in FEA requires special consideration because weld joints create geometric discontinuities that produce stress concentrations. Unlike parent material, welds introduce abrupt changes in cross-section, material properties, and residual stresses that standard meshing approaches cannot accurately capture. Understanding these fundamentals is essential before attempting any weld stress analysis.
Why Standard Meshing Fails at Weld Joints
Engineers spend days chasing mesh convergence at weld toes, not realizing they’re pursuing a mathematical impossibility. The sharp corner at a weld toe represents a geometric singularity where linear elastic theory predicts infinite stress. No amount of mesh refinement will produce a converged value—you’ll simply get progressively higher numbers that have no physical meaning.
> ⚠️ Common Mistake: Reporting peak stress values directly from weld toe elements as design stresses. These mesh-dependent values will change with every mesh refinement and cannot be used for fatigue assessment in weld FEA projects.
Geometric Idealization Strategies for Weldments
Analysts can choose between shell/plate element models and solid element models depending on the complexity of the structure and the stress quantity being evaluated.
In a plate or shell element model, elements are arranged along the mid-plane of each structural component. Quadratic 8-noded elements are recommended, particularly in regions of steep stress gradients. In simplified weld FEA models, the weld itself is typically not explicitly represented — the connected plates are merged at a common intersection. An exception arises when local bending effects are significant, such as when an axial offset exists between plates or when adjacent welds are closely spaced. In these situations, the weld can be approximated using short vertical or inclined plate elements with appropriate stiffness, or alternatively by introducing constraint equations or rigid links to enforce compatible node displacements. It is important to recognize that thin-shell elements inherently produce a linear stress distribution through the thickness, which suppresses the notch stress at the weld toe. As a result, the structural hot-spot stress is typically recovered by surface extrapolation from reference points located away from the weld, particularly at locations prone to stress singularities such as stiffener ends or plate terminations.

For more complex geometries, or where greater accuracy near the weld toe is required, prismatic solid elements are the preferred alternative in weld FEA. Isoparametric 20-node elements with mid-side nodes, for example, support quadratic displacement functions and allow a linear stress distribution in the thickness direction — enabling a single element layer through the plate thickness when used with reduced integration. This formulation allows the linear stress component to be evaluated directly at the element surface and extrapolated to the weld toe. When solid elements are used, explicit modeling of the weld geometry is generally recommended. A multi-layer arrangement of solid elements further enables direct linearization of stresses through the plate thickness at the weld toe itself, without reliance on surface extrapolation. Additionally, the element width in front of the attachment should not exceed the attachment width — defined as the attachment thickness plus twice the weld leg length — to ensure adequate resolution in regions of steep transverse stress gradients.
Stress Extraction Methods for Weld FEA Analysis
Stress extraction methods determine whether your weld FEA results are usable for fatigue assessment. There are different approaches to defining weld stresses in FEA. The nominal and hot spot stress methods are the most popular among them. Each method has specific mesh requirements and corresponding S-N curves—mismatching these elements is a common source of non-conservative or overly conservative results.
Hot Spot Stress Method Implementation
At any welded joint, the stress field near the weld toe is made up of three contributions: a through-thickness membrane component σ_m, a bending component σ_b varying linearly across the plate thickness, and a sharply localised non-linear peak σ_nl concentrated at the surface layer immediately adjacent to the weld toe. The first two components together form the structural stress — governed by the overall geometry, load path, and boundary conditions of the joint. The third, σ_nl, arises purely from the notch sharpness of the weld profile and dissipates rapidly with distance from the toe.

In a weld FEA model, the weld toe is a geometric discontinuity, and the raw computed stress at that point is inherently mesh-sensitive. In hot spot stress method, to avoid this singular point, surface stresses are sampled at reference points positioned far enough from the weld toe that the notch effect has dissipated, and the linear structural stress field dominates. A polynomial fit through these values is then projected back to the toe location, yielding a stable, mesh-independent stress quantity that is physically consistent with the fatigue assessment framework.
The method is the appropriate choice when the structural configuration makes it difficult to assign a meaningful nominal stress — for example, in geometrically complex nodes where no well-defined reference cross-section exists — or when the joint cannot be matched to a standard classified fatigue detail. It is applicable to plate, shell, and tubular structures where fatigue cracking is expected to initiate at the weld toe.
Strictly, the method is defined for weld toe assessment. Where the concern is instead a weld root, the surface hot spot stress can serve as a surrogate indicator of the subsurface stress state, but this extension carries important caveats: the applicable S-N curves and stress concentration factors are strongly dependent on the specific geometry, and their use is valid only within the parametric bounds for which they were derived (Hobbacher, §2.2.3.1).
In joints subject to biaxial surface stress, the component acting closest to perpendicular to the weld toe — conventionally, within a ±60° band of the toe-normal direction — is the relevant fatigue driver and should be used in the assessment. The stress running roughly parallel to the weld may warrant a separate check under the nominal stress classification system, where applicable.
Types of Hot Spots
Two geometric configurations of weld toe are recognised, and each requires a different extrapolation strategy:
Type “a” — weld toe crossing the plate surface: The weld toe runs across the flat face of a plate, and the fatigue-driving stress acts perpendicular to it in the plate plane. Typical examples include transverse attachments, gussets, and stiffener terminations. Because the stress gradient in this configuration is governed by bending through the plate thickness, the reference point spacing is normalised to the plate thickness t.
Type “b” — weld toe at the plate edge: The weld toe sits at the free edge of a plate, and the relevant stress acts perpendicular to it in the plane of the plate edge. Here, the stress gradient is controlled by in-plane geometry rather than plate thickness, so reference points are set at fixed millimetre distances, independent of t.

Surface stress extrapolation: fine mesh procedures
The innermost reference point must sit far enough from the weld toe that the locally elevated notch stress has fallen away and only the linearly varying structural stress remains. For Type “a” configurations, this condition is met at a distance of 0.4t from the toe — any closer, and the reading would be distorted by the notch peak.
Type “a” – Thickness-normalized reference points
Two-point linear extrapolation (fine mesh): Element size ≤ 0.4t. Stresses are read at 0.4t and 1.0t from the weld toe:
$$\sigma_{hs} = 1.67 \sigma_{0.4t} – 0.67 \sigma_{1.0t} \tag{1}$$
Type “b” – Absolute reference points
For plate-edge hot spots, the stress field does not scale with plate thickness. Reference distances are therefore fixed.
Three-point quadratic extrapolation (fine mesh): Element size ≤ 4 mm. Stresses sampled at 4 mm, 8 mm, and 12 mm from the weld toe:
$$\sigma_{hs} = 3\sigma_{4mm} – 3 \sigma_{8mm} + \sigma_{12mm} \tag{2}$$
The three-point quadratic form is the default for Type “b” because edge stress gradients can be steep, making a two-point linear fit insufficiently accurate.

> 💡 Pro Tip: For correct stress interpolation in weld FEA, the reference points should not be on the same element and the first interpolation point should not be on the element of the welded part. This ensures you’re capturing the structural stress gradient rather than element-specific artifacts.
Nominal Stress vs. Structural Stress Approaches
The nominal stress method is the longest-established and most widely adopted approach for fatigue assessment of welded structures, underpinning design codes including the IIW Recommendations, Eurocode 3 (EN 1993-1-9), and the AISC fatigue provisions. Its premise is straightforward: each standardised weld geometry — referred to as a classified structural detail — is assigned a resistance curve, designated by its FAT class, which represents the characteristic stress range (in MPa) at which that joint survives two million load cycles at a 95% survival probability. The analyst computes a nominal stress in the structural member at the weld location, compares the resulting stress range against the appropriate FAT-class S-N curve, and reads off the predicted fatigue life.
The S-N curves themselves are empirically derived from large specimen databases and already embed the stress-raising effect of the weld geometry. Consequently, the nominal stress entering the comparison must be the far-field structural stress — the stress the member would carry in the absence of the weld’s local notch influence.
How nominal stress is defined
The nominal stress is computed at a cross-section of the parent structural member — not through the weld bead itself. In a simple beam-like member, this is the familiar result from linear-elastic structural mechanics: axial force divided by cross-sectional area, plus bending moment divided by section modulus. The weld geometry is deliberately ignored at this stage; only the overall member shape enters the calculation.
For joints where the governing failure mode is cracking through the weld throat — particularly load-carrying fillet welds in shear, or cruciform joints susceptible to root failure — the stress must be referred to the weld throat cross-section instead.

This method has the advantage of its simplicity, but does present a series of limitations. It is not applicable to materials or constructive details not listed in the standard, and even for cases listed, it may be difficult to judge the class of the welded joint. Additionally, welded joints can develop fatigue cracks in areas different from those listed in the standard. Even with the shortcomings of the method, it is still the most commonly used due to its simplicity.
The major difference can be described as that the hot spot stress method incorporates the more competent measure geometrical stress, as opposed to the more limited measure nominal stress. Due to this fact, the hot-spot approach requires fewer detail categories than the nominal stress to provide comparable versatility.
Effective Notch Stress Method for Detailed Analysis
The effective notch stress method operates on a fundamentally different principle from both the nominal and hot-spot approaches. Rather than evaluating stress at a remote cross-section or extrapolating to the weld toe, it resolves the full elastic stress peak at the weld notch itself — at either the weld toe or the weld root — and compares it against a single universal fatigue resistance curve.
Because the actual weld profile varies between joints and cannot be precisely characterised, the real weld contour is replaced with a standardised fictitious one in which every notch is rounded to a reference radius of r = 1 mm (Hobbacher, §2.2.4.1). This radius is not a physical measurement but a theoretically derived value, calibrated to account simultaneously for the statistical scatter in weld shape parameters and for the non-linear micro-mechanical support effect of the material immediately beneath the notch surface — a concept rooted in Neuber’s microstructural support theory. For both structural steels and aluminium alloys, this 1 mm radius has been shown to produce consistent fatigue predictions across a wide range of joint geometries.

Since the effective notch radius is a modelling idealisation rather than a real geometric feature, it cannot be measured on a fabricated weld. This distinguishes the method sharply from nominal stress and hot-spot approaches, where strain gauges placed at defined locations can serve as an independent experimental check. For the effective notch stress method, weld FEA is the only viable means of determining the stress amplitude — there is no experimental equivalent.
This places strict demands on the finite element model. To resolve the steep stress gradient within the 1 mm rounded notch accurately, the IIW recommends element sizes of no more than r/4 (≤ 0.25 mm) for quadratic elements with mid-side nodes, and r/6 (≤ 0.15 mm) for linear elements — maintained in both the tangential and normal directions along the notch surface, through at least three elements per 45° arc (Hobbacher, Table 2.4). Applying this level of refinement across a full structural model is computationally prohibitive. Submodelling provides the practical solution: a coarse global model resolves the load distribution, and a finely meshed local submodel — focused on the weld region of interest — inherits the boundary displacements and delivers the notch stress with the required resolution.
Additional constraints govern the method’s scope: it is limited to plate thicknesses t ≥ 5 mm, restricted to failure modes initiating at the weld toe or root, and is not applicable where a significant stress component acts parallel to the weld line. Misalignment must be incorporated explicitly into the weld FEA model, and a complementary hot-spot stress check of the parent material in the weld vicinity remains mandatory.

Mesh Requirements and Best Practices for Weld Simulation
Mesh requirements for weld FEA vary significantly depending on your chosen stress extraction method. Using hot spot stress mesh guidelines with a notch stress approach—or vice versa—will produce incorrect results regardless of how carefully you extract stresses. The mesh must be designed with the end use in mind from the start of the modeling process.
Element Selection for Weld Modeling
A structured quadrilateral mesh (for shell models) or structured hexahedral mesh (for solid models) is ideal for weld stress evaluation. Structured meshes allow precise control over element placement at reference points and produce more accurate, mesh-size-independent solutions with relatively larger elements compared to unstructured tetrahedral meshes. This is particularly valuable when evaluating the fatigue life of individual welds across large welded structures.
For shell-based weld FEA models, eight-noded quadrilateral elements with mid-side nodes capture stress gradients more accurately than four-noded linear elements. In solid models, 20-noded hexahedral elements are preferred in weld regions. When tetrahedral elements are unavoidable due to geometric complexity, use second-order (10-noded) tetrahedra and ensure sufficient refinement to capture the stress gradient between reference points.
Shell element models are particularly efficient for weld FEA because they naturally provide the through-thickness stress distribution needed for structural stress methods. A well-constructed shell model with seam weld connections allows both weld toe and weld root fatigue assessment without the overhead of full solid geometry.
Mesh Density Guidelines by Analysis Type
For the hot spot stress method, the IIW guidelines specify that the element size at the weld toe region should be no larger than 0.4t, where t is the plate thickness. This ensures that at least one element edge aligns with the first reference point for stress extrapolation. Finer meshes are acceptable but provide diminishing returns once the reference points are adequately resolved.
For fillet weld modeling with solid elements, a practical rule of thumb is to place at least three elements (four nodes) along the weld face. For a right-angle fillet weld, this translates to an element size equal to the weld leg divided by 2.13. For example, a 6.35 mm (¼”) fillet weld requires an element size of approximately 3.0 mm along the weld face. Fewer than three elements produces unreliable results; additional refinement beyond this point yields diminishing improvement for most structural stress methods.
| Method | Stress Definition | Mesh Requirement | S-N Curve Source | Best Application |
|---|---|---|---|---|
| Nominal Stress | Beam theory / simple FEA | Coarse away from weld | Detail category tables FAT classes | Standard joints listed in codes |
| Hot Spot Stress | Surface extrapolation to weld toe | Element size ≤ 0.4t at toe | Hot spot S-N curves FAT 90 / FAT 100 | Complex geometry, non-standard joints |
| Effective Notch Stress | Stress at fictitious notch r = 1 mm | Element size ≤ 0.25 mm at notch | Universal notch S-N curve FAT 225 | Detailed root / toe assessment |
Fatigue Assessment of Welded Joints Using FEA
Fatigue assessment connects your FEA stress results to predicted service life. Welded joints represent the most common locations of fatigue crack initiation in steel structures because the combination of stress concentration, residual stress, and microstructural changes at the heat-affected zone dramatically reduces fatigue resistance compared to parent material. The critical requirement is matching your stress extraction method to the appropriate S-N curve—using hot spot stresses with nominal stress S-N data produces meaningless life predictions.
S-N Curve Selection and Code Requirements
Design codes including IIW, AWS D1.1, Eurocode 3, DNV, and FKM provide S-N curves explicitly matched to specific stress extraction methods. For the nominal stress method, each FAT class (e.g., FAT 71, FAT 90, FAT 100) corresponds to a specific joint detail and includes the stress concentration effect of that particular geometry within the S-N curve itself. For hot spot stress assessment, a reduced set of S-N curves applies—typically FAT 90 or FAT 100, with the distinction often being between fully load-carrying and nominally non-load-carrying welds.

For the effective notch stress method, a single universal S-N curve (FAT 225 for steel, FAT 71 for aluminum) covers all joint geometries because the full notch stress concentration is explicitly calculated rather than embedded in the S-N curve. This universality is the method’s primary advantage for non-standard joints.
Fatigue analysis is performed by comparing the calculated stress range against the chosen S-N curve at the required number of cycles. For every critical location, a Haigh diagram or equivalent mean stress correction may be needed, with different corrections applied for plain metal, cut edges, weld toes, and weld roots depending on the code.
Multiaxial Loading and Variable Amplitude Considerations
For biaxial stress states at the plate surface, the IIW recommendations suggest using the principal stress that acts approximately perpendicular to the weld toe—specifically, within ±60° of the normal to the weld line. This simplification works well for proportional loading but may be non-conservative for non-proportional multiaxial stress histories where the principal stress direction rotates during the load cycle.
Variable amplitude loading introduces additional complexity through load sequence effects and the need for cycle counting methods such as the rainflow counting algorithm. Cumulative damage is typically assessed using Palmgren-Miner’s rule, though most codes apply a modified version with a reduced damage sum (often D ≤ 0.5 rather than D ≤ 1.0) to account for the known non-conservatism of linear damage accumulation in welded joints.
Common Errors and Troubleshooting in Weld Stress Analysis
Even experienced analysts encounter pitfalls in weld FEA. The errors described below account for the majority of unreliable weld fatigue assessments seen in practice, and recognizing them early saves significant rework.
Identifying Mesh-Dependent Results
The hallmark of a singularity-driven result is stress that increases with each mesh refinement rather than converging. Additional indicators include: the peak stress location migrating to progressively smaller elements, computed stress values exceeding the material’s ultimate tensile strength by large margins, and results that change significantly when switching between element types (e.g., linear to quadratic). If your weld toe stress exhibits any of these behaviors, you are observing a mathematical artifact rather than a physically meaningful stress state.
The solution is not to refine further but to step back and apply one of the stress extraction methods described earlier. Hot spot stress extrapolation, structural stress linearization, or effective notch stress with a fictitious radius all provide mesh-convergent results because they are specifically designed to bypass the singularity.
Boundary Condition and Load Application Errors
Constraints and loads applied too close to weld regions create artificial stress concentrations unrelated to actual weld behavior. Point loads on shell models generate localized stress spikes that can be mistaken for weld stress concentrations. Similarly, rigid body element (RBE) connections that transfer loads directly into weld toe nodes bypass the stress distribution that would occur through the actual weld throat, producing unrealistic force flow patterns.
When using the nominal stress method, care must be taken to ensure that all stress concentration effects from the structural detail of the welded joint are excluded from the computed nominal stress. This means extracting stress from a location where beam theory or simple hand calculations would apply, confirming that the FEA value matches the expected analytical result before using it with FAT class S-N curves. If the FEA nominal stress significantly exceeds the hand-calculated value, geometric stress raising effects are contaminating your extraction point, and you should either move the extraction location or switch to the hot spot stress method.
Frequently Asked Questions (FAQ)
What is the hot spot stress method in weld FEA?
The hot spot stress method determines fatigue life by extrapolating surface stresses from reference points away from the weld toe back to the toe location. This extrapolated value—called the structural or geometric stress—includes the effect of the overall joint geometry but excludes the local non-linear notch peak caused by the weld toe radius. It eliminates mesh sensitivity because the reference points lie outside the singularity-influenced zone.
How do you avoid stress singularities in weld finite element analysis?
Never use peak stress values directly from sharp weld toe corners. Instead, apply one of three established approaches: hot spot stress extrapolation from reference points at 0.4t and 1.0t from the toe, through-thickness stress linearization to separate membrane and bending components, or the effective notch stress method with a 1 mm fictitious weld toe radius. Each method produces mesh-convergent results that can be paired with appropriate S-N curves.
What mesh size should I use for weld FEA?
Mesh size depends on your stress extraction method. For hot spot stress analysis, element size at the weld toe should not exceed 0.4 times the plate thickness. For the effective notch stress method, elements smaller than 0.25 mm are required at the fictitious 1 mm toe radius. For nominal stress assessment, a coarse mesh is acceptable since stresses are extracted away from the weld detail. A practical rule for fillet weld solid models is at least three elements across the weld leg.
What is the difference between nominal stress and structural stress methods for welds?
The nominal stress method uses simplified beam-theory stress (or coarse FEA stress away from the weld) paired with detail-category-specific S-N curves that already embed the stress concentration effect. The structural (hot spot) stress method calculates the actual geometric stress at the weld toe through surface extrapolation, then uses a smaller set of S-N curves. The structural stress approach is more versatile for non-standard joints but requires finer meshes and careful reference point placement.
Can shell elements be used for weld fatigue analysis?
Yes. Shell element models are widely used and often preferred for weld FEA because they efficiently represent thin-walled welded structures while naturally providing through-thickness stress distributions. Shell models work well with both the nominal and hot spot stress methods. Welds can be represented using rigid links, constraint equations, or inclined shell elements with appropriate stiffness to capture load transfer through the joint.
Which design codes cover weld fatigue assessment with FEA?
The International Institute of Welding (IIW) recommendations provide the most comprehensive FEA-specific guidance for weld fatigue, including detailed rules for hot spot and notch stress methods. Eurocode 3 (EN 1993-1-9) covers nominal and hot spot stress approaches for steel structures. DNV-RP-C203 addresses offshore and marine applications. AWS D1.1 provides nominal stress-based fatigue provisions. FKM and DVS guidelines cover German industrial practice. Each code specifies method-specific S-N curves and mesh requirements.
References:
- Hobbacher, A.F., Recommendations for Fatigue Design of Welded Joints and Components (2016). IIW Document IIW-2259-15, Springer.
- EN 1993-1-9: Eurocode 3 — Design of Steel Structures, Part 1-9: Fatigue (2005). European Committee for Standardization.
- DNV-RP-C203, “Fatigue Design of Offshore Steel Structures” (2021). Det Norske Veritas.

I am a mechanical engineer in the fields of thermal energy storage, fluid mechanics and heat transfer. I have obtained my PhD from KTH Royal Institute of Technology in designing robust and compact additively manufactured prototypes. During my PhD, I worked on CFD modeling and optimization of innovative heat exchanger designs and conducted experiments of the manufactured prototypes in laboratory environments.
In June 2019, I managed to secure the funding for continuation of my PhD by receiving a grant of 3.7 MSEK from the Swedish Energy Agency on development of 3Dprineted air-PCM heat exchangers.