
Key Takeaways
Weld toe stress concentration factors range from 1.5 to 4.0 depending on geometry.
Element sizes of 0.1–0.4 mm are needed to capture peak toe stresses
Hot-spot extrapolation provides mesh-insensitive fatigue stress results
- Grinding or TIG dressing must penetrate at least 0.5 mm to remove toe intrusions
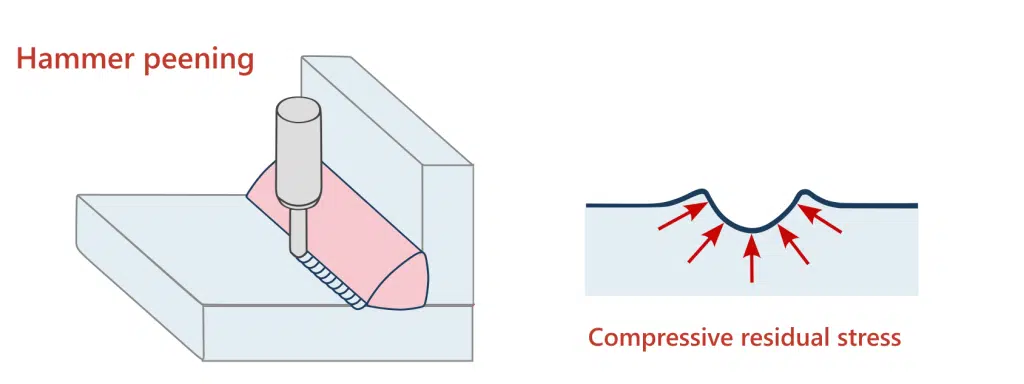
Table of Contents
The weld toe is the single most critical location for fatigue crack initiation in welded structures, yet accurately capturing its stress state remains one of the most persistent challenges in FEA modeling. Refine your mesh at the toe, and stress values keep climbing without convergence; use coarse elements, and you underestimate peak stresses by factors that could compromise your entire fatigue assessment. This article establishes precise definitions, examines the geometric parameters that drive stress concentration, reviews quality acceptance criteria from major codes, and provides practical guidance for incorporating weld toe considerations into your structural simulations.
What Is the Weld Toe? Anatomy and Definition
The weld toe is the junction point where the weld face meets the base metal surface. This geometric transition creates an inherent stress concentration factor (SCF) that typically ranges from 1.5 to 4.0, depending on toe angle, radius, and weld profile. In fillet welds, the toe represents the most fatigue-critical location requiring refined mesh treatment in any finite element model.
Unlike idealized CAD geometry, real weld toes exhibit microscopic features that significantly influence fatigue behavior. Sharp, nonmetallic intrusions are present in most welds, with their extent varying based on the welding process and base metal quality. These crack-like features combine with geometric stress concentration to make the toe the dominant crack initiation site in welded joints.

Weld Toe vs. Weld Root: Critical Distinctions
The weld root sits at the deepest penetration point, opposite the face, and its failure modes differ fundamentally from toe failures. While the weld toe experiences surface-initiated fatigue cracking driven by stress concentration, root failures typically stem from lack-of-fusion defects or incomplete penetration.
For FEA mesh refinement, this distinction matters. Toe regions require surface mesh density sufficient to capture steep stress gradients, while root assessment often demands through-thickness refinement to evaluate potential embedded defects. Your mesh strategy should reflect these different failure mechanisms rather than applying uniform refinement throughout the weld zone.
Geometric Parameters Affecting Toe Behavior
The stress concentration factor (SCF) at the weld toe depends on several interrelated geometric variables. The toe radius (r), weld flank angle (θ), plate thickness (t), and weld attachment width (L) combine to determine the degree of local stress amplification. The total notch stress could be a combination of several stress components. For instance, for a weld joint under combined tensile and bending loading, the total notch stress at the weld toe decomposes into three components: membrane stress (σ_m), shell bending stress (σ_b), and the non-linear stress peak (σ_nlp). The notch stress concentration factor (SCF) relates the total local notch stress to the nominal stress, and the geometric parameters listed above govern how severely that non-linear peak develops at the toe.

Several researchers have developed parametric formulas that capture these relationships through FEA-based regression studies, each with specific validity boundaries. The most widely cited include Monahan (1995) [6], valid for r/t = 0.02–0.066, θ = 30°–60°, and L/t = 2.8; Brennan et al. (2000) [7], which extended the range to r/t = 0.01–0.066, θ = 30°–60°, and L/t = 0.3–4.0; and more recently Molski & Tarasiuk (2021) [9], covering r/a ≤ 1.3, a/t ≤ 1.3, and θ = 30°–60° for T-joints under tension, bending, and shear. For butt-welded plates, Kiyak, Madia & Zerbst (2016) [8] extended the application range to toe radii of 0.1–4.0 mm and flank angles of 10°–60°.
| Formula | Joint Type | Loading | Validity Ranges |
|---|---|---|---|
| Monahan (1995) | T-joint | Tension, bending | r/t = 0.02–0.066 θ = 30°–60° L/t = 2.8 (fixed) |
| Brennan et al. (2000) | T-joint | Tension, bending | r/t = 0.01–0.066 θ = 30°–60° L/t = 0.3–4.0 |
| Kiyak et al. (2016) | Butt weld (Single-V, Double-V) | Tension, bending | r = 0.1–4.0 mm α = 10°–60° h = 0.75, 2.5 mm t = 10 mm |
| Molski & Tarasiuk (2021) | T-joint, cruciform | Tension, bending, shear | r/a = 0–1.3 a/t = 0–1.3 T/a = 1–4 θ = 30°–60° |
A smaller toe radius creates a sharper geometric transition that concentrates stress into a narrower zone. In the limiting case of a perfectly sharp toe (zero radius), the stress field contains a mathematical singularity — a critical consideration for FEA modeling that we explore in the next section. This singularity behavior has been rigorously characterized by Molski & Tarasiuk (2021), who showed that proper handling of the zero-radius limit is essential for achieving parametric equation accuracy better than 98% across the full range of geometric variables.
Stress Concentration at the Weld Toe: FEA Considerations
Weld toe stress concentration in FEA requires element sizes of 0.1-0.4mm at the toe radius to capture peak stresses accurately. Hot-spot stress methods using surface extrapolation provide mesh-insensitive alternatives for fatigue assessment when local notch stresses prove impractical to resolve with available computational resources.
The fundamental challenge is that sharp geometric transitions produce theoretically infinite stresses at zero radius—a mathematical singularity that mesh refinement cannot resolve. This is where the effective notch stress approach becomes valuable, introducing a fictitious 1mm radius at the weld toe to produce finite, comparable stress values.
Mesh Sensitivity and Convergence Studies
I’ve seen many engineers overlook the importance of documenting their convergence behavior at weld toes. The method is limited to thicknesses t ≥ 5mm, since verification for smaller wall thicknesses remains incomplete. For thinner sections, alternative approaches or additional validation becomes necessary.
When modeling machined or ground toes with specified profiles, assess using the notch stress of the actual profile combined with the nominal stress-based fatigue resistance curve for a butt weld ground flush to plate. This approach accounts for the improved weld toe geometry while maintaining consistency with established S-N data.
> ⚠️ Common Mistake: Using automatic mesh sizing without local refinement at weld toes. The resulting stress underestimation can exceed 40%, leading to unconservative fatigue life predictions.
Hot-Spot vs. Notch Stress Approaches
Effective notch stresses and stress concentration factors can be calculated through parametric formulas, extracted from diagrams, or computed using finite element or boundary element models. The choice depends on joint complexity and required accuracy.
For standard joint configurations, the hot-spot method with surface stress extrapolation (0.4t/1.0t or 0.5t/1.5t from the weld toe) offers computational efficiency. The effective notch stress method, while more demanding, provides direct comparison against material fatigue resistance.
| Method | Mesh Requirement | Applicable Thickness | Key Advantage |
|---|---|---|---|
| Nominal Stress | Coarse (standard) | All | Simplest; uses tabulated S-N curves |
| Hot-Spot (Structural) Stress | Moderate (t/10 at toe) | ≥ 5 mm | Mesh-insensitive via extrapolation |
| Effective Notch Stress | Fine (≤ 0.25 mm at r = 1 mm) | ≥ 5 mm | Single universal S-N curve |
| Fracture Mechanics | Very fine at crack tip | All | Handles known defects and crack growth |
Common Weld Toe Defects and Their Impact on Structural Integrity
Weld toe undercut, cold lap, and excessive convexity amplify stress concentration beyond design assumptions. Undercut is a groove eroded into the base metal at the weld toe, left unfilled by weld metal. It acts as a built-in notch, and depths exceeding 0.5 mm require explicit geometric representation in your model. Cold lap (or overlap) occurs when molten weld metal rolls over the base plate surface without fully fusing to it, leaving a sharp crack-like crevice at the toe boundary. These defects invalidate idealized FEA geometry, requiring models to incorporate as-built conditions for accurate life prediction.
The origin of microscopic weld toe intrusions isn’t fully understood, but slag, surface scale, and nonmetallic stringers from contaminated steel are considered primary causes. These features can reach 0.4 mm in depth, creating stress risers that accelerate crack initiation.

Weld toe intrusions are sharp, crack-like features that concentrate stress beyond what macroscopic geometry alone would suggest. Combined with the stress concentration from weld profile shape, these microscopic defects explain why welded joints exhibit lower fatigue performance than unwelded base metal — even when nominal stresses remain well below yield.
For fatigue-critical applications, FEA assumptions should reflect realistic defect populations rather than idealized geometry. This typically means applying appropriate fatigue reduction factors or explicitly modeling worst-case defect geometries at the weld toe.
Quality Standards and Acceptance Criteria for Weld Toe Geometry
ISO 5817 specifies weld toe angle limits and undercut depths by quality level, while AWS D1.1 requires smooth toe transitions with undercut limits varying by loading type. These code requirements establish the geometric baseline that should inform your FEA modeling assumptions and mesh refinement decisions.
Understanding acceptance criteria helps you determine appropriate modeling conservatism. A weld meeting quality level B represents different geometry than level D—and your stress predictions should reflect this reality.
Code Requirements: AWS, ISO, and DNV Standards
The American Welding Society’s weld profile procedure, including the “dime” test, reduces weld geometry Kt and hence increases fatigue life. This practical quality control measure directly influences the stress concentration your FEA model should predict at the weld toe.
| Standard | Undercut Limit (Static) | Undercut Limit (Fatigue) | Toe Angle Requirement |
|---|---|---|---|
| AWS D1.1 | ≤ 1.0 mm | ≤ 0.25 mm | Smooth transition required |
| ISO 5817 Level B | ≤ 0.5 mm | ≤ 0.5 mm | Smooth transition (≤ 30° recommended) |
| ISO 5817 Level C | ≤ 0.5 mm (short) / ≤ 1.0 mm | ≤ 0.5 mm (short) | No sharp transitions |
| DNV-OS-C401 | Per NDE acceptance criteria | Per fatigue class | Profile per S-N curve basis |
> 💡 Pro Tip: When as-built geometry data isn’t available, use code minimum requirements as your modeling baseline. This provides defensible conservatism while avoiding unrealistic idealization of weld toe conditions.
For cyclically loaded structures, acceptance criteria tighten significantly compared to static applications. Your FEA fatigue assessment should reflect the quality level actually achieved—or conservatively assume minimum acceptable geometry.
Weld Toe Improvement Techniques for Fatigue Life Extension
Weld toe grinding, TIG dressing, and peening treatments improve fatigue life by reducing stress concentration and introducing beneficial compressive residual stresses. FEA fatigue assessments must apply appropriate improvement factors per IIW recommendations when these treatments are specified in design documents.
Methods for removing weld toe intrusions include grinding, machining, or remelting. These techniques focus on altering local weld geometry by removing intrusions while achieving smooth transition between weld and plate.
Geometry Modification Techniques
Because weld toe intrusions can reach 0.4mm depth, the general guideline requires grinding or machining operations to penetrate at least 0.5mm into the parent plate. The depth, groove diameter, and grinding mark direction all influence effectiveness.
In GTAW and plasma dressing, the weld toe is remelted to improve local profile and eliminate intrusions. The arc position relative to the toe and remelt zone depth are critical variables requiring careful control.
Methods modifying the residual stress field include heat treatment, hammer peening, shot peening, and overloading. Postweld heat treatment reduces tensile residual stresses but doesn’t eliminate them completely.
Residual Stress Modification Techniques
Several post-weld treatments improve fatigue performance by altering the residual stress state at the weld toe. Post-weld heat treatment partially relieves the tensile residual stresses that develop during welding, though it rarely eliminates them entirely.
Mechanical peening methods take a different approach — rather than relieving stress, they actively introduce compressive residual stresses into the surface layer. This matters because fatigue cracks initiate and grow under tensile stress; a compressive stress field at the weld toe effectively counteracts the tensile portion of each load cycle, reducing the net stress driving crack growth. The result is a slower crack initiation phase and an extended fatigue life.

Hammer peening achieves this by repeatedly striking the weld toe with a hardened tool tip — manually or pneumatically — plastically stretching the surface layer and locking in compressive stresses to depths of 1–3 mm. Shot peening works on the same principle but covers larger areas: thousands of small hardened spheres are projected at high velocity, each impact leaving a shallow indentation that pushes the surrounding material into compression.
High-frequency mechanical impact (HFMI) treatment is a more controlled evolution of peening, offering better repeatability and well-documented improvement factors from IIW, calibrated against steel yield strength. Higher-strength steels gain the most benefit because the compressive field introduced is larger relative to the stress range they experience in service.
Frequently Asked Questions (FAQ)
What is the toes of the weld?
The weld toe is the interface where weld metal surface meets base metal, forming a geometric transition that concentrates stress during loading. This location experiences the highest local stresses and represents the primary fatigue crack initiation site in welded joints.
What is the weld toe root and throat?
The toe is the surface junction with base metal, the root is the deepest penetration point, and the throat is the minimum distance from root to face. Each location requires different FEA mesh refinement strategies and assessment approaches.
How do you measure weld toe angle?
Weld toe angle is measured between the base metal surface and the tangent to the weld face at the toe. Physical measurement uses weld gauges or laser profilometry; for FEA, extract geometry from CAD models or 3D scan data.
Why does the weld toe crack first in fatigue failure?
The weld toe cracks first because geometric discontinuity creates stress concentration factors of 1.5-4.0 times nominal stress. Combined with tensile residual stresses and microscopic intrusions acting as crack initiators, the toe experiences the highest effective stress range.
What weld toe radius improves fatigue life?
Increasing weld toe radius from sharp (<0.5mm) to 2-4mm through grinding or TIG dressing reduces SCF by 30-50%. IIW recommends a minimum 1mm fictitious radius for effective notch stress FEA calculations when assessing improved profiles.
References:
- Hobbacher, A.F., Recommendations for Fatigue Design of Welded Joints and Components (2016). IIW Document IIW-2259-15, Springer.
- Fricke, W., “Guideline for the Fatigue Assessment by Notch Stress Analysis for Welded Structures” (2012). IIW Document IIW-2240-08.
- Marquis, G.B. and Barsoum, Z., “IIW Recommendations for the HFMI Treatment” (2016). IIW Document IIW-2259-15, Springer.
- AWS D1.1/D1.1M, Structural Welding Code—Steel (2020). American Welding Society.
- ISO 5817, Welding—Fusion-Welded Joints in Steel, Nickel, Titanium and Their Alloys—Quality Levels for Imperfections (2014). International Organization for Standardization.
Monahan, C.C., Early Fatigue Crack Growth at Welds, Topics in Engineering, Vol. 26, Computational Mechanics Publications, Southampton, UK (1995), pp. 112–116.
Brennan, F.P., Peleties, P., and Hellier, A.K., “Predicting Weld Toe Stress Concentration Factors for T and Skewed T-Joint Plate Connections,” Int. J. Fatigue, Vol. 22 (2000), pp. 573–584.
Radaj, D., Sonsino, C.M., and Fricke, W., Fatigue Assessment of Welded Joints by Local Approaches, 2nd ed., Woodhead Publishing (2006) — the comprehensive compendium covering all approaches.

I am a mechanical engineer in the fields of thermal energy storage, fluid mechanics and heat transfer. I have obtained my PhD from KTH Royal Institute of Technology in designing robust and compact additively manufactured prototypes. During my PhD, I worked on CFD modeling and optimization of innovative heat exchanger designs and conducted experiments of the manufactured prototypes in laboratory environments.
In June 2019, I managed to secure the funding for continuation of my PhD by receiving a grant of 3.7 MSEK from the Swedish Energy Agency on development of 3Dprineted air-PCM heat exchangers.
I am a mechanical engineer in the fields of thermal energy storage, fluid mechanics and heat transfer. I have obtained my PhD from KTH Royal Institute of Technology in designing robust and compact additively manufactured prototypes. During my PhD, I worked on CFD modeling and optimization of innovative heat exchanger designs and conducted experiments of the manufactured prototypes in laboratory environments.
In June 2019, I managed to secure the funding for continuation of my PhD by receiving a grant of 3.7 MSEK from the Swedish Energy Agency on development of 3Dprineted air-PCM heat exchangers.